Graduate Research
Analysis of long-duration freezing rain events
I completed my Ph.D. in June 2020 under the supervision of Prof. John Gyakum and Dr. Eyad Atallah. My dissertation examined the conditions associated with long-duration freezing rain events over North America. Freezing rain tends to persist for very short durations, usually only 1-2 hours. This is partly a result of the latent heat release which occurs as the rain freezes at the surface. This often causes temperatures to rise to 0°C, thus changing precipitation to rain. A great deal of research into the synoptic and mesoscale conditions associated with freezing rain has been done particularly over the past 20 or so years, though several key questions remain. Here are a few which are guiding our current research:
- What synoptic conditions lead to long-duration freezing rain events?
- What conditions distinguish short-duration freezing rain events from those that persist for many hours?
- Why do some locations observe more long-duration freezing rain events than others?
- Why do some locations observe longer-duration freezing rain events than others?
This work has been presented in three peer-reviewed publications in Weather and Forecasting and Monthly Weather Review:
McCray, C.D., E.H. Atallah, and J.R. Gyakum, 2019: Long-Duration Freezing Rain Events over North America: Regional Climatology and Thermodynamic Evolution. Weather and Forecasting, 34, 665–681, https://doi.org/10.1175/WAF-D-18-0154.1 (A PDF of the paper can also be downloaded at this link , © Copyright 2019 AMS)
McCray, C.D., J.R. Gyakum, and E.H. Atallah, 2020: Regional Thermodynamic Characteristics Distinguishing Long- and Short-Duration Freezing Rain Events over North America. Weather and Forecasting, 35, 657–671, https://doi.org/10.1175/WAF-D-19-0179.1 (A PDF of the paper can also be downloaded at this link , © Copyright 2020 AMS)
McCray, C.D., J.R. Gyakum, and E.H. Atallah, 2021: Synoptic-Dynamic and Airmass Characteristics Distinguishing Long- and Short-Duration Freezing Rain Events in the South-Central United States. Accepted to Monthly Weather Review, https://doi.org/10.1175/MWR-D-20-0306.1
Verification of WPC freezing rain forecasts (2017 NCEP Summer Student Internship)
Within the U.S. National Weather Service (NWS), the Weather Prediction Center (WPC) is responsible for the issuance of deterministic and probabilistic ice accretion guidance twice daily out to three days over the contiguous United States. To generate the guidance, a blend of outputs from U.S. and international forecast models is post-processed using a modified version of the Freezing Rain Accumulation Model (FRAM) (Sanders and Barjenbruch 2016). WPC forecasters assign weights to each model and then get an initial freezing rain accretion output from the resulting blend using the FRAM. Forecasters can then manually edit these forecast grids before issuing the guidance.
This guidance has historically been difficult to validate due to a lack of reliable ice accretion observations. Starting in 2013, several hundred surface observing stations within the Automated Surface Observing System (ASOS) network began reporting hourly ice accretion amounts as determined by a sensor used to detect freezing precipitation. These sensors consist of a vibrating probe whose frequency has been found to decrease linearly with increasing ice mass (see Ryerson and Ramsay 2007). This provides the first network of routine, objective measurements of ice accretion in the United States.
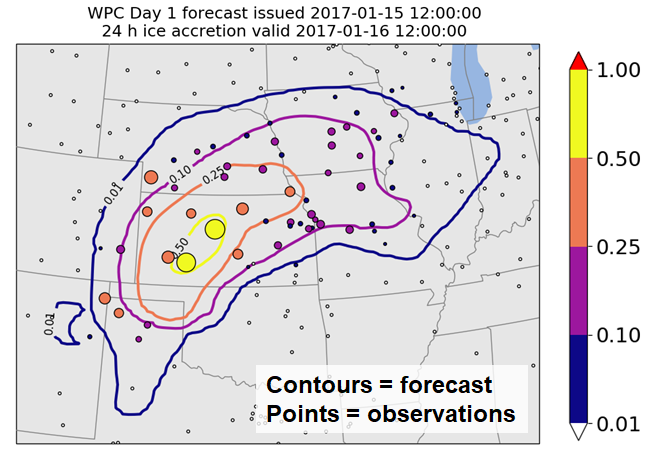
I spent the summer of 2017 at the WPC and helped develop a verification technique using this new observational dataset. Using hourly surface observations from 562 stations with ice accretion reporting capabilities, we verified WPC’s ice accretion guidance for the winters of 2015-2016 and 2016-2017. By summing hourly accretion observations over each 24-hour forecast period at each station, we obtain an objective measurement against which we can fairly compare the forecasts. In general, ice accretion observations appear spatially and temporally coherent, lending confidence to the use of this dataset for verification purposes. Figure 1 shows an example from a severe freezing rain event over the Southern Plains of the United States in January 2017. The observed 24-hour ice accretion totals tend to be very close to the forecasts for this event (shown in contours for several thresholds). Our analysis showed that, overall, WPC freezing rain guidance performs quite well. However, we identified a low bias for the high ice accretion cases - the WPC tends to under-forecast more extreme amounts. This information will be used by WPC developers to test and improve their techniques for the post-processing of model output which generates the initial field of ice accretion forecasts. Through this improved verification method, we hope to improve WPC’s ice accretion guidance in the upcoming winter seasons.
Undergraduate Research
Impact of the Lake Champlain Valley on Freezing Rain Events at Burlington, Vermont
For my undergraduate senior thesis at Lyndon State College, I examined surface observations of freezing rain at Burlington, VT (KBTV). Burlington has been heavily impacted by ice storms on several occasions, most notably during the 1998 Ice Storm and a similar but less persistent event in December 2013. Gyakum and Roebber (2003) showed that the Lake Champlain Valley acted as an important channel through which cold air drained from the north, allowing temperatures to remain at or below freezing and preventing freezing rain from changing to plain rain in Burlington for much of the 1998 storm.
My analysis of KBTV surface observations showed that freezing rain events at Burlington occur under both northerly and southerly winds. Southerly winds are rather rare during freezing rain at most locations, as they are often associated with warm-air advection. To better understand how these events occur, I partitioned the dataset into 13 long-duration (6+ hours of FZRA) NNW events, where winds were between 270 and 45 degrees, and 13 SSE events, where winds were between 90 and 225 degrees. Composites of these events using the North American Regional Reanalysis (NARR) showed that NNW events were characterized by a cyclonecentered to the south of Burlington over the mid-Atlantic states, with a strong anticyclone to the north over northern Quebec. This setup is conducive to pressure-driven channelling in the LCV, in which wind flows following the pressure gradient from north to south down the valley. SSE events are associated with a more west-east positioning of the cyclone and anticyclone, with the composite low centered over Michigan and composite high centered over the Maritime Provinces of Canada, a setup which produces southerly synoptic flow over the valley which is observed down to the surface.
To answer the question of how these SSE events can occur, I examined surface observations during and before the events. The key here is that SSE events occurred with a colder temperature at onset (mean of -2.2 deg C) than NNW events (mean of -4.9 deg C), with a much colder air mass in place prior to onset. This allowed for warming to occur under the SSE winds for several hours without pushing the temperature above 0 deg C.