Python Resources for Atmospheric Scientists
Meteorological Python Tutorials | Why Python? | Getting Started in Python | Tutorials for Beginners
On this page, you'll find resources to learn Python and use it for your atmospheric science work. If you're looking for resources to get set up with Python, skip down to the Getting Started section for helpful tips and links.
In the main tutorials section just below, you'll find links to fairly detailed tutorials on using meteorological data in Python. To run these for yourself, click on the link and then click the download button in the top right corner of the Notebook. Some tutorials also require you to download the dataset and to place it in the same directory as the notebook for the code to run properly.
Keep in mind that this code isn't necessarily optimized for speed and efficiency. If you have any questions or suggestions, or notice any errors, please feel free to contact me!
Python tutorials for meteorology/atmospheric science
1) Intro to Python, basic weather data analysis with Pandas, and plotting
 Tutorial and code (Jupyter Notebook)
In this tutorial, which I originally gave as a CAOS workshop, I go over the basic features of Python and give an intro to reading in weather data (CSV format), analyzing it with Pandas, and plotting it. Key points include:
- Basic features: data structures, loops, fuctions
- Basic math, math with NumPy
- Intro to plotting with matplotlib
- Reading weather data in csv format with Pandas
- Basic weather data analysis/manipulation with Pandas
2) Importing and mapping reanalysis data in Python
 Tutorial and code (Jupyter Notebook) | Data Download (~105 mb)
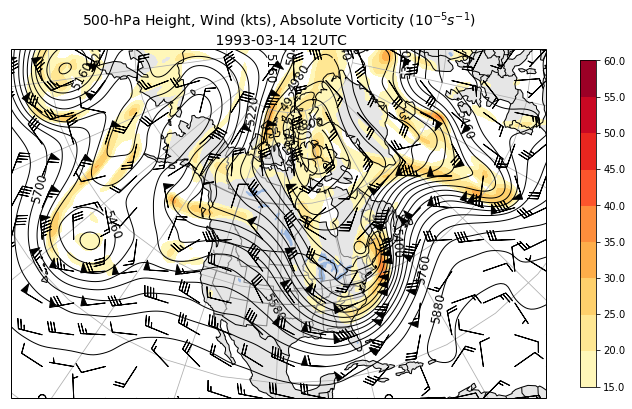
In this tutorial, I show how to import and plot CFSR data (NetCDF), using an example from the March 1993 "Storm of the Century." Key points include:
- Reading a NetCDF file in Python (xarray)
- Modifying and selecting variables using xarray
- Setting up a map with cartopy
- Plotting contour and filled contour (contourf) plots with matplotlib
- Plotting wind barbs with cartopy
- Making colorbars, titles, and saving figures in matplotlib
3) Introduction to Pandas
 Tutorial and code (Jupyter Notebook)
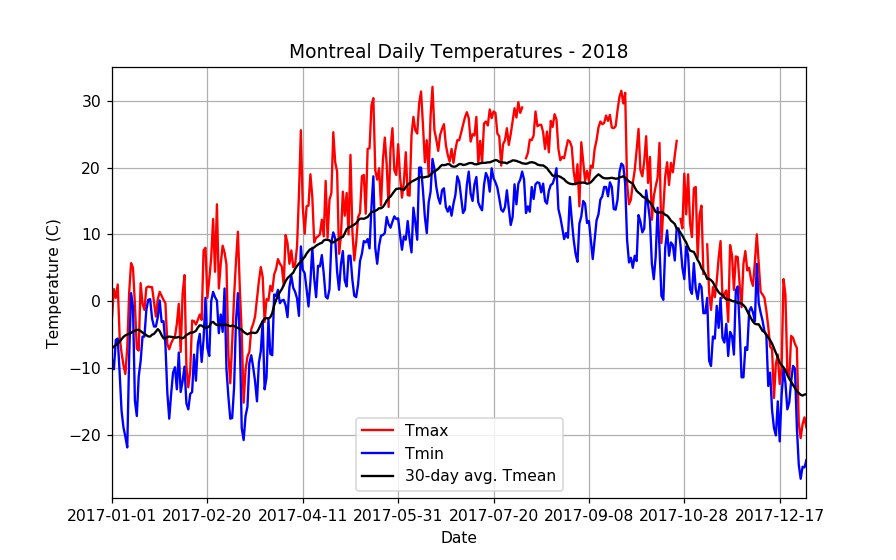
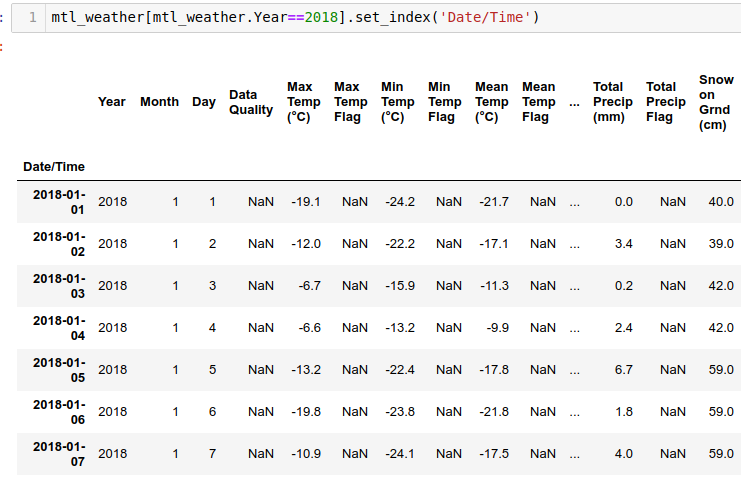
This tutorial is focused on the basic usage of Pandas, a key data science package in Python. I show how Pandas can be used to analyze a CSV file with nearly 150 years of daily weather data from Montreal. Key points include:
- Creating and manipulating Pandas DataFrames
- Reading csv files with Pandas
- Calculating statistics from this data
- Plotting data quickly with Pandas
Why Python?
Python has become an extremely popular data analysis and mapping tool in the atmospheric sciences. Most of my research is done using Python and its many available packages. While field-specific systems like GEMPAK make plotting meteorological data fairly straightforward, calculations can be more challenging. Python makes grid calculations more intuitive and allows for customized plots/maps without much legwork.
Every programming language has its positive and negative aspects. There are many reasons to use Python over others. The key positive of Python is that Python is open source. This fosters an environment where users are also developers, creating helpful packages for almost any use. For users of MATLAB, Python has many similarities, and many Python packages were created based largely off of MATLAB syntax.
Getting started in Python
One of the major positive aspects of Python can also make it seem overwhelming to a new user - the huge range of packages available. With MATLAB, most of the functions you'll need are there right out of the box. Not so in Python. Here are some steps to make getting started with Python quick and easy.
- Download Anaconda. Anaconda is a Python package manager that comes with Python itself as well as the major libraries necessary for scientific computing. Anaconda also makes it easy to install other packages and update those you have.
- Decide whether to use Python 2.7 or 3.6. Python 3.6 is the current version, although some packages have been slow to develop compatability with it. See this link for more information and differences. At this point, you should use Python 3, as most packages have been updated and many will drop Python 2 support in the next couple of years.
- Work in Jupyter Notebook/JupyterLab or choose an IDE. A very popular option is to code using Jupyter Notebook (formerly iPython Notebook, which ships with Anaconda), which I use for my tutorials. These allow you to make your code highly readable and easy to present. Click here and here for more information. To get a MATLAB-like environment, where you can see and interact with your variables in GUI form, run blocks of code, etc., check out Spyder, which is also included with Anaconda.
- Start coding! There are lots of getting-started tutorials available online. Search for some and start practicing! Python is a fairly intuitive language to work with, especially if you have a little prior programming experience. Have fun!
Tutorials and Resources for Python Beginners
If you're just starting out in Python, check out some of the tutorials below from other sources
- Basic Python syntax and structure. Numerous resources are available for learning Python basics depending on your past programming experience. Here is one quick overview.
- A quick tour of Jupyter Notebook.
- Analyzing CSV/TXT datasets: Pandas cookbook. This contains several tutorials (some with weather data!)on getting started in Pandas, which has myriad functions that make exploring CSV data VERY simple, including calculations and graphing.
Back to top